You can’t manage what you don’t measure. With Kii, we provide you with the right data so that you can accurately demonstrate that your investment is making a difference to employee health and the bottom line.

Utilization and Engagement Reporting
Demographics of users
Age, location, primary language, gender
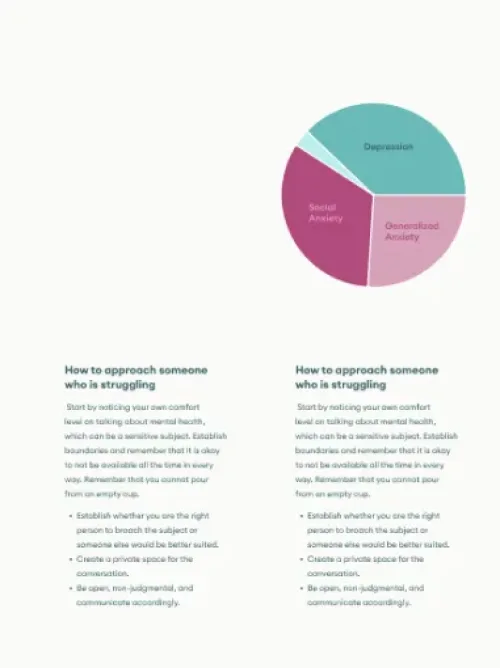
Concerns Addressed
Primary reason for calls, concerns addressed in treatment
Platform & Service Utilization
Accounts Created, Monthly Usage. Usage per service type, Usage per modality (video, telephonic, messaging, in-person)
Employee Engagement
Platform engagement, webinar registration, wellness content engagement

Clinical Outcome
Reporting
Symptom Reduction
Clients will be assessed at the start of treatment and regularly reassessed using scientifically validated screening tools for their specific area of concerns.
Clinically Significant Improvement
If a treatment is clinically significant, it has been determined that it is capable of bringing a client back to a relatively normal functioning, or at least a marked improvement.
Better Outcomes Initiative Reports & Webinars
Regular access to published studies of data across the entire member population and webinars with researchers to explain the results.

Business Outcome
Reporting
Resiliency & Absence Prevention
Clients will receive a survey asking questions about resiliency (an indicator of risk of absence) at the start and end of services.
Productivity
When appropriate we administer the Sheehan Disability scale to understand productivity improvement.
Return on Investment
Reductions in duration of disability claims, Readiness to RTW, Reduced absence.

Employee Satisfaction
Reporting
Net Promoter Score (NPS)
After every interaction with one of our clinicians an employee will be given a satisfaction survey using standard NPS methodology via the platform or email.


